

Variable Distance
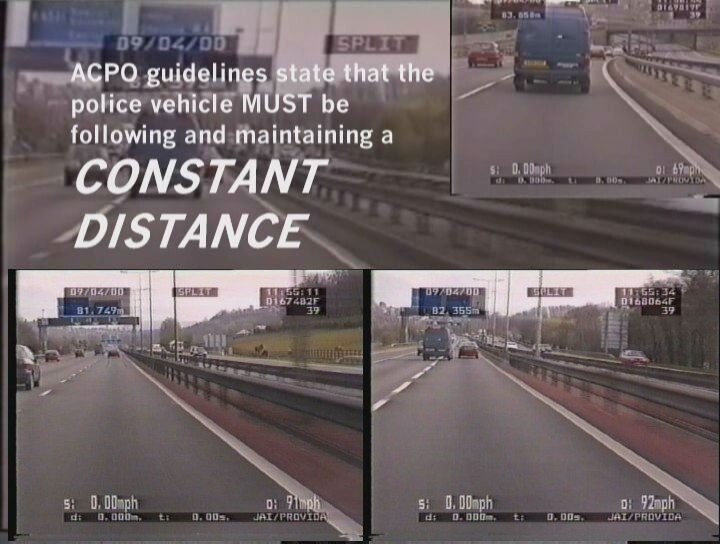 We've produced this composite picture using frames from the traffic video to illustrate how easy it is to obtain a speed reading from the police car's speedometer substantially higher than the speed the target vehicle is actually travelling at. To understand what the picture shows, you should first familiarise yourself with the ProVida system's display.
At first glance the police car seems to be more or less at a constant distance, at the start (the image in the bottom left hand corner of the frame) and end (bottom right hand corner) of the half-mile section.
Since the police car was travelling at 91-92 mph throughout, the conclusion seems simple - the target vehicle was also travelling at 91-92 mph.
In fact the target's speed was considerably lower. When following a long way behind, as here, it's very difficult to tell just from looking at the image how much closer the two cars are at the end of the half-mile section than at the beginning. That difference has a big effect: at 70 mph closing up by just 100 yards over half a mile adds 8 mph to the speed reading!
On our VASCAR page we've published the details of a "follow check" where the time and distance device was used correctly, and it's interesting because the target vehicle's average speed is considerably lower than the speed of the patrol car - could this be because the patrol car was "catching up"?!


Information
News
Latest forum topics


Page updated: 27 Mar 2006

